Results and Discussion
 |
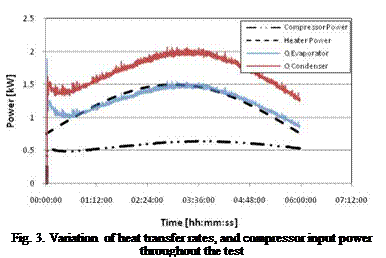
An analysis was conducted on the operation of an ISAHP with a varying temperature input. The mains water temperature, and therefore initial storage tank temperature was approximately 20°C. Figure 3 shows the power delivered to the glycol through the heaters, as well as; heat transferred to the refrigerant through the evaporator; heat rejected to the natural convection loop through the condenser; and power consumed by the compressor.
As shown in Figure 3, the heat transferred from the glycol through the evaporator exceeds the heat delivered to the glycol through the auxiliary heaters. This is due to a large amount of glycol in the auxiliary heaters which are initially at a higher temperature. The heat pump unit extracts the extra energy until the heat transferred through the evaporator matches the heat input to the glycol through the heaters. Finally, the heat transfer through the evaporator is observed to lag the heater input, again due to the volume of glycol in the auxiliary heaters.
A temperature probe installed within the storage tank, with thermocouples spaced 0.15 m apart, was used to determine the level of stratification of the tank. Figure 4 shows the temperatures measured in the tank throughout the test, with T11 being the temperature measured at the top of the tank, and T20 measured at the bottom. During the test the tank was observed to stratify well, and throughout the test the temperature at the bottom of the tank, T20, remains constant at approximately 21°C. Therefore, over the course of the test, the temperature of the water entering the natural convection heat exchanger/condenser was effectively constant at 21°C.
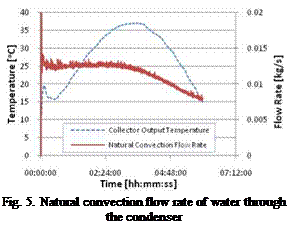
The natural convection flow rate was also calculated over the length of the test. Figure 5 shows the natural convection flow rate of water through the condenser, plotted with the temperature of glycol delivered to the evaporator on the same graph. Consistent with the previous constant temperature tests, it was observed that higher glycol temperatures delivered to the evaporator increased the flow rate, and an increase in tank temperature decrease the flow rate. This resulted in the natural convection flow rate remaining constant for the first half of the test, and then decreasing as the glycol temperature declined, and tank temperature continued to increase.
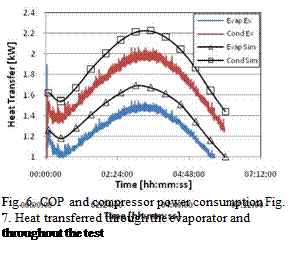
In order to compare the dynamic operation of the heat pump with the steady-state model, the measured compressor power and heat pump COP were plotted with the simulated results on the same figure. To assist in validating the computer model, the simulation was run under the same conditions as the experiment. The model predicted the power consumed by the compressor, the
 |
 |
evaporator and condenser heat transfer rates, and the COP of the system. Figure 6 shows the heat transfer rates through the condenser and evaporator and Figure 7 shows the COP and compressor power curves throughout the test. Both simulated and experimental values are displayed.
COP values measured throughout the test ranged from 2.4 to 3.2, and the measured compressor power ranged from 484 to 635 W. The amount of heat transferred through the condenser to the natural convection loop ranged from 1300 to 2000 kW.
Similar to the previous tests [13] run at constant glycol temperatures, the simulation program was found to overestimate the COP and heat transferred through both heat exchangers, but predicted the compressor power consumption reasonably well. Both heat transfer rates, and the COP, were over-predicted by the simulation by approximately 12%. These results were previously attributed to an over estimation of the heat exchanger effectiveness values. Neglecting this offset, the simulation, based on a steady-state governing equations, predicts the trend of the heat pump system well.